select_h#
- QuadratiK.kernel_test.select_h(x: ndarray | DataFrame, y: ndarray | DataFrame | None = None, alternative: str = 'location', method: str = 'subsampling', b: float = 0.8, num_iter: int = 150, delta_dim: ndarray | int = 1, delta: ndarray | None = None, h_values: ndarray | None = None, n_rep: int = 50, n_jobs: int = 8, quantile: float = 0.95, k_threshold: int = 10, power_plot: bool = False, random_state: int | None = None, mu: ndarray | None = None, sigma: ndarray | None = None) tuple[float, DataFrame] | tuple[float, DataFrame, Figure]#
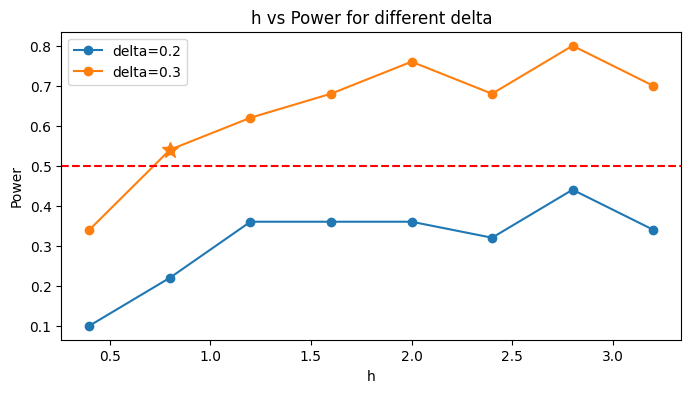
This function computes the kernel bandwidth of the Gaussian kernel for the one sample, two-sample and k-sample kernel-based quadratic distance (KBQD) tests.
The function performs the selection of the optimal value for the tuning parameter h of the normal kernel function, for the two-sample and k-sample KBQD tests. It performs a small simulation study, generating samples according to the family of a specified alternative, for the chosen values of h_values and delta.
We consider target alternatives \(F_\delta(\hat{\mathbf{\mu}}, \hat{\mathbf{\Sigma}}, \hat{\mathbf{\lambda}})\), where \(\hat{\mathbf{\mu}}, \hat{\mathbf{\Sigma}}\) and \(\hat{\mathbf{\lambda}}\) indicate the location, covariance, and skewness parameter estimates from the pooled sample.
The available alternative options are:
location alternatives, \(F_\delta = SN_d(\hat{\mu} + \delta, \hat{\Sigma}, \hat{\lambda})\),
with \(\delta = 0.2, 0.3, 0.4\);
scale alternatives, \(F_\delta = SN_d(\hat{\mu}, \hat{\Sigma} \cdot \delta, \hat{\lambda})\),
with \(\delta = 1.1, 1.3, 1.5\);
skewness alternatives, \(F_\delta = SN_d(\hat{\mu}, \hat{\Sigma}, \hat{\lambda} + \delta)\),
with \(\delta = 0.2, 0.3, 0.6\). Note: Skewness is not available for the normality test.
Please see User Guide for more details.
Parameters#
- xnumpy.ndarray or pandas.DataFrame
Data set of observations from X.
- ynumpy.ndarray or pandas.DataFrame, optional
Data set of observations from Y for two sample test or set of labels in case of k-sample test.
- alternativestr, optional
Family of alternative chosen for selecting h, must be one of “location”, “scale” and “skewness”. Defaults to “location”.
- methodstr, optional.
The method used for critical value estimation, must be one of “subsampling”, “bootstrap”, or “permutation”. Defaults to “subsampling”.
- bfloat, optional.
The size of the subsamples used in the subsampling algorithm. Defaults to 0.8 i.e. 0.8N samples are used, where N represents the total sample size.
- num_iterint, optional.
The number of iterations to use for critical value estimation. Defaults to 150.
- delta_dimint, numpy.ndarray, optional.
Array of coefficient of alternative with respect to each dimension. Defaults to 1.
- deltanumpy.ndarray, optional.
Array of parameter values indicating chosen alternatives. Defaults to None.
- h_valuesnumpy.ndarray, optional.
Values of the tuning parameter used for the selection. Defaults to None.
- n_repint, optional. Defaults to 50.
Number of bootstrap replications.
- n_jobsint, optional.
n_jobs specifies the maximum number of concurrently running workers. If 1 is given, no joblib parallelism is used at all, which is useful for debugging. For more information on joblib n_jobs refer to - https://joblib.readthedocs.io/en/latest/generated/joblib.Parallel.html. Defaults to 8.
- quantilefloat, optional.
Quantile to use for critical value estimation. Defaults to 0.95.
- k_thresholdint.
Maximum number of groups allowed. Defaults to 10.
- power_plotboolean, optional.
If True, plot is displayed the plot of power for values in h\_values and delta. Defaults to False.
- random_stateint, None, optional.
Seed for random number generation. Defaults to None.
- munumpy.ndarray, optional
Mean vector for the reference distribution. Mandatory for the normality test. Defaults to None.
- sigmanumpy.ndarray, optional
Covariance matrix of the reference distribution. Mandatory for the normality test. Defaults to None.
Returns#
- hfloat
The selected value of tuning parameter h.
- h vs Power tablepandas.DataFrame
A table containing the h, delta and corresponding powers.
References#
Markatou, M., & Saraceno, G. (2024). A unified framework for multivariate two-sample and k-sample kernel-based quadratic distance goodness-of-fit tests. arXiv preprint arXiv:2407.16374.
Examples#
import numpy as np
from QuadratiK.kernel_test import select_h
np.random.seed(42)
X = np.random.randn(200, 2)
np.random.seed(42)
y = np.random.randint(0, 2, 200)
h_selected, all_values, power_plot = select_h(
    X, y, alternative='location', power_plot=True, random_state=42)
print("Selected h is: ", h_selected)
Selected h is: 0.8