plot_clusters_2d#
- QuadratiK.tools.plot_clusters_2d(x: ndarray | DataFrame, y: ndarray | DataFrame | None = None) Figure#
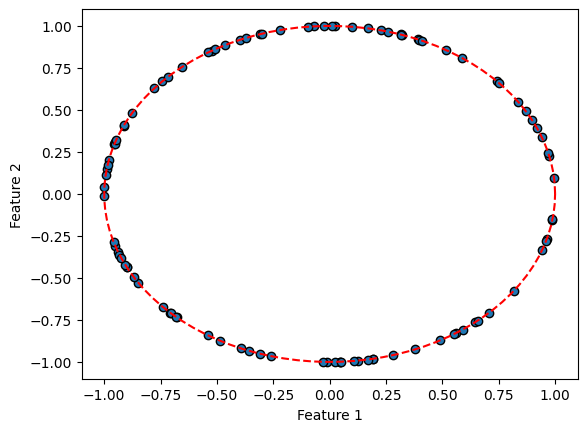
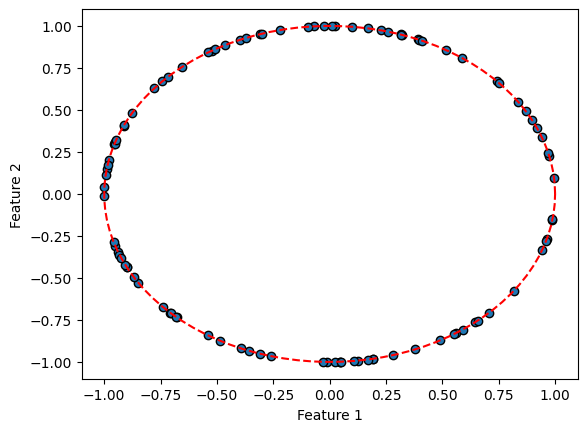
This function plots a 2D scatter plot of data points, with an optional argument to color the points based on a cluster label, and also plots a unit circle.
Parameters#
- xnumpy.ndarray, pandas.DataFrame
The parameter x is a 2-dimensional array or matrix containing the coordinates of the data points to be plotted. Each row of x represents the coordinates of a single data point in the 2-dimensional space.
- ynumpy.ndarray, pandas.DataFrame, optional
The parameter y is an optional array that represents the labels or cluster assignments for each data point in x. If y is provided, the data points will be colored according to their labels or cluster assignments.
Returns#
A matplotlib figure object.
Examples#
import numpy as np
from QuadratiK.tools import plot_clusters_2d
np.random.seed(42)
X = np.random.randn(100,2)
X = X/np.linalg.norm(X,axis = 1, keepdims=True)
plots = plot_clusters_2d(X)
plots